1

How much are we talking?

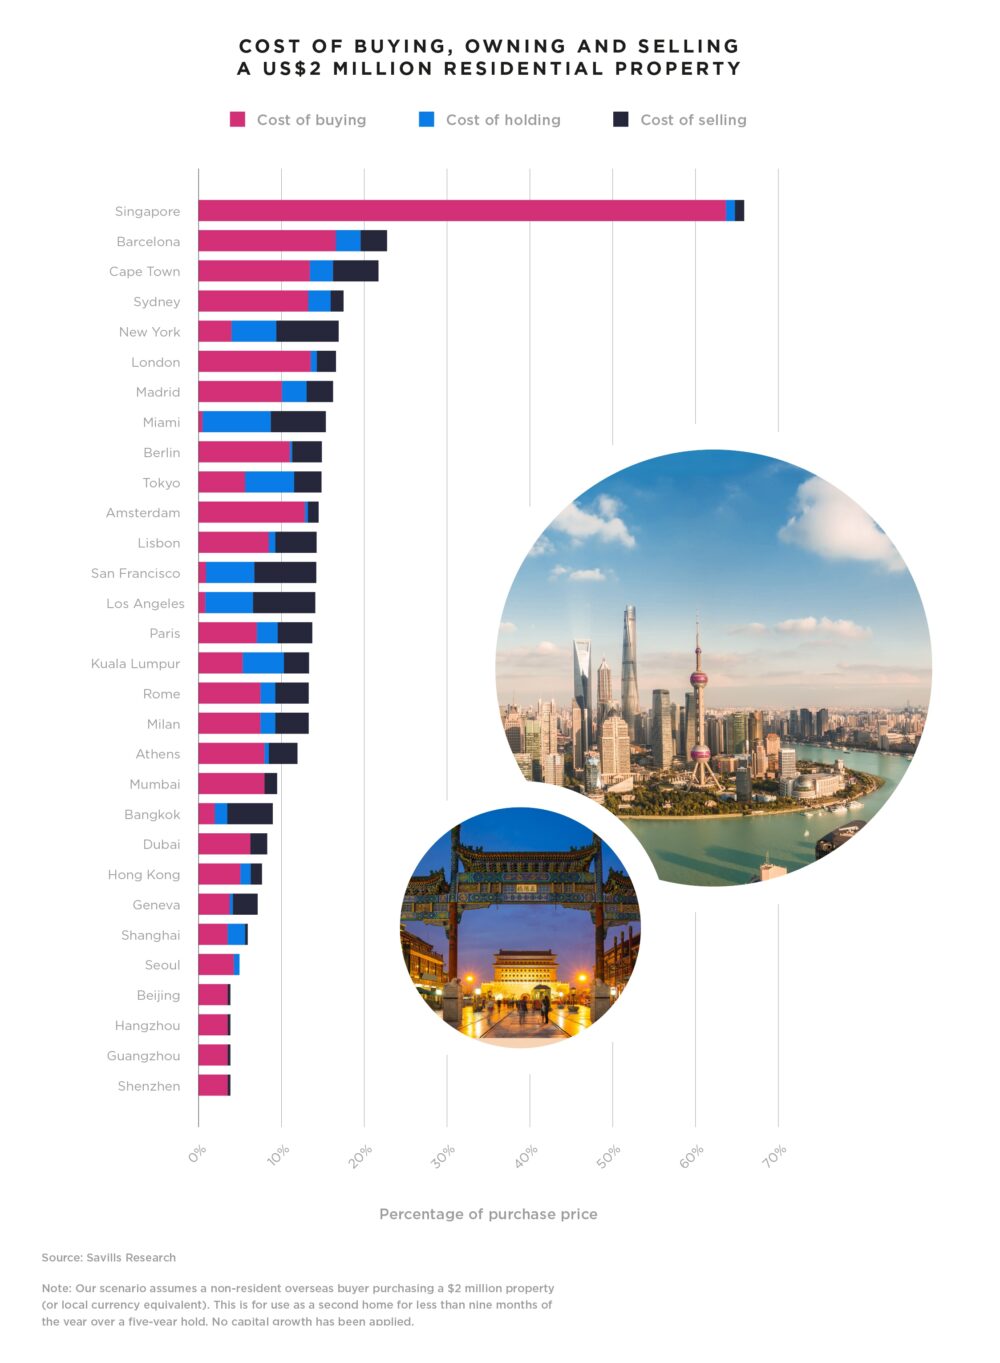
Overall, across the 30 markets monitored, the costs associated with buying, holding and selling average 15% of the purchase price. That covers an individual range from 4.3% in cities in mainland China to 66% in Singapore.

* Figures are based on the purchase of a $2 million (or local equivalent) property, by a non-resident foreign buyer, who holds it for five years before selling. Capital growth is not included. 


2

Buying is the biggest cost

In most cities, buying represents the largest proportion of the overall costs of property ownership – just under two-thirds of total buy/hold/sell costs on average.

3

What’s happening in the US?

Notable exceptions are US cities, where the additional costs of buying represent the smallest proportion of overall costs of all locations on the Index. In New York, Miami, San Francisco and Los Angeles, buying costs are significantly lower than holding and selling costs. 

4

Which city is the most expensive?

Singapore is the most expensive location for property ownership in all 30 cities by a substantial distance, thanks to an Additional Buyer’s Stamp Duty of 60%. The cost in Barcelona, the next most expensive city in the list, is almost three times lower.


5

What about Hong Kong?

In contrast, Hong Kong lowered its stamp duty in 2023, from 15% to 7.5%, in an effort to stimulate activity, placing it in the bottom third of the table. Over the past five years, governments worldwide have increasingly used taxes as a way to spur or dampen demand,” says Kelcie Sellers, associate director of World Research at Savills. 

6

Where are holding costs highest?

Holding costs are highest in US cities, where the average annual property tax is 6.3% of the purchase price over a five-year period. In comparison, they typically amount to 1.6% in the Asia-Pacific region (APAC) and 1.3% in Europe, the Middle East and Africa (EMEA). There are no holding costs at all in most Chinese cities.

7

What about selling costs?

Selling costs range from 0% in Seoul to 2% in Dubai, 4% in Rome and 7.5% in New York, where sellers face an additional real estate transfer tax.

8

And rental values?

Looking at the top locations for capital value and rental growth in the first half of 2025, Tokyo led the pack for both, registering capital value growth of 8.8% and rental value growth of 7.8%. 

9

What’s happening in Cape Town?

Cape Town saw capital values rise by 3.2% and rental values by 6.5% as confidence and stability returned to the market. In Europe, Sellers highlights the performance of Berlin and Amsterdam, where rental values rose by 6.3% and 2.6% respectively. 

10

In conclusion...

“The Index shows that in the first half of 2025, despite volatile financial markets, prime residential rents in the 30 cities monitored rose by a remarkably stable 2%,” says Sellers. “And even though prime capital values grew by a relatively modest 0.7% in that period, 60% of locations registered positive capital growth.”